Job Concurrency in Kubernetes: LXD & CPU pinning to the rescue
-
A few days ago, someone shared with me a project to run video transcoding jobs in Kubernetes.
During her tests, made on a default Kubernetes installation on bare metal servers with 40 cores & 512GB RAM, she allocated 5 full CPU cores to each of the transcoding pods, then scaled up to 6 concurrent tasks per node, thus loading the machines at 75% (on paper). The expectation was that these jobs would run at the same speed as a single task.
The result was a slightly underwelming: while concurrency was going up, performance on individual task was going down. At maximum concurrency, they actually observed 50% decrease on single task performance.
I did some research to understand this behavior. It is referenced in several Kubernetes issues such as #10570,#171, in general via a Google Search. The documentation itself sheds some light on how the default scheduler work and why the performance can be impacted by concurrency on intensive tasks.There are different methods to allocate CPU time to containers:
- CPU Pining: each container gets a set of cores
If the host has enough CPU cores available, allocate 5 “physical cores” that will be dedicated to this pod/container- Temporal slicing: considering the host has N cores collectively representing an amount of compute time which you allocate to containers. 5% of CPU time means that for every 100ms, 5ms of compute are dedicated to the task.
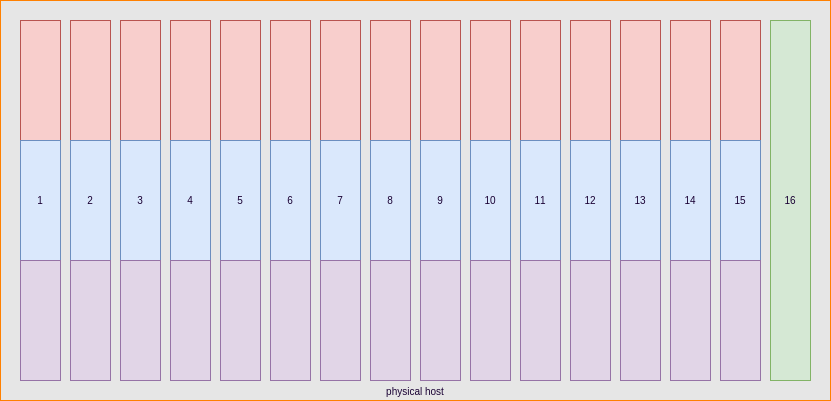
Temporal slicing, each container gets allocated randomly on all nodesObviously, pining CPUs can be interesting for some specific workloads but has a big problem of scale for the simple reason you could not run more pods than you have cores in your cluster.As a result, Docker defaults to the second one, which also ensures you can have less than 1 CPU allocated to a container.
This has an impact on performance which also happens in HPC or any CPU intensive task.
Can we mitigate this risk? Maybe. Docker provides the cpuset option at the engine level. It’s not however leveraged by Kubernetes. However, LXD containers have the ability to be pined to physical cores via cpusets, in an automated fashion, as explained in this blog post by @stgraber.
This opens 2 new options for scheduling our workloads:
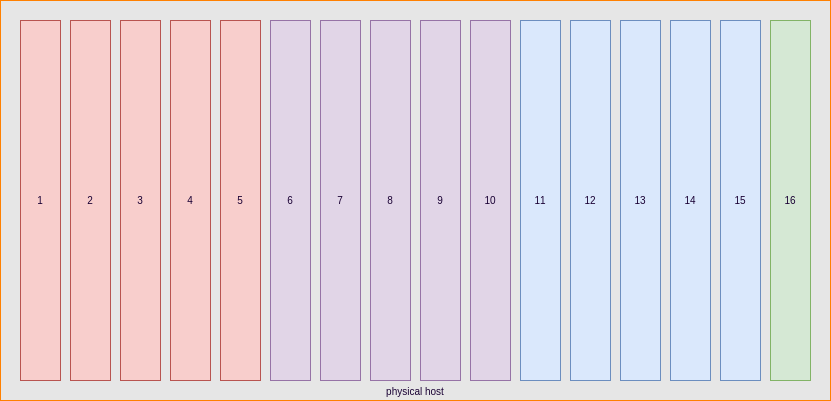
- Slice up our hosts in several LXD Kubernetes Workers and see if pining CPUs for workers can help up;
- Include a “burst” option with the native Kubernetes resource primitives, and see if that can help maximise compute throughput in our cluster.
Let’s see how these compare!
TL;DR
You don’t all have the time to read the whole thing so in a nutshell:
- If you always allocate less than 1 CPU to your pods, concurrency doesn’t impact CPU-bound performance;
- If you know in advance your max concurrency and it is not too high, then adding more workers with LXD and CPU pinning them always gets you better performance than native scheduling via Docker;
- The winning strategy is always to super provision CPU limits to the max so that every bit of performance is allocated instantly to your pods
Note: these results are in AWS, where there is a hypervisor between the metal and the units. I am waiting for hardware with enough cores to complete the task. If you have hardware you’d like to throw at this, be my guest and I’ll help you run the tests.
The Plan
In this blog post, we will do the following:
- Setup various Kubernetes clusters: pure bare metal, pure cloud, in LXD containers with strict CPU allocation.
- Design a minimalistic Helm chart to easily create parallelism
- Run benchmarks to scale concurrency (up to 32 threads/node)
- Extract and process logs from these runs to see how concurrency impacts performance per core
Requirements
For this blog post, it is assumed that:
-
You are familiar with Kubernetes
-
You have notions of Helm charting or of Go Templates, as well as using Helm to deploy stuff
-
Having preliminary knowledge of the Canonical Distribution of Kubernetes (CDK) is a plus, but not required.
-
Downloading the code for this post:
git clone https://github.com/madeden/blogposts cd blogposts/k8s-transcode
Methodology
Our benchmark is a transcoding task. It uses a ffmpeg workload, designed to minimize time to encode by exhausting all the resources allocated to compute as fast as possible. We use a single video for the encoding, so that all transcoding tasks can be compared. To minimize bottlenecks other than pure compute, we use a relatively low bandwidth video, stored locally on each host.
The transcoding job is run multiple times, with the following variations:
- CPU allocation from 0.1 to 7 CPU Cores
- Memory from 0.5 to 8GB RAM
- Concurrency from 1 to 32 concurrent threads per host
- (Concurrency * CPU Allocation) never exceeds the number of cores of a single host
We measure for each pod how long the encoding takes, then look at correlations between that and our variables.
Charting a simple transcoder
Transcoding with ffmpeg and Docker
When I want to do something with a video, the first thing I do is call my friend Ronan. He knows everything about everything for transcoding (and more)!
So I asked him something pretty straightforward: I want the most CPU intensive ffmpeg transcoding one liner you can think of.
He came back (in less than 30min) with not only the one liner, but also found a very neat docker image for it, kudos to Julien for making this. All together you get:
docker run --rm -v $PWD:/tmp jrottenberg/ffmpeg:ubuntu \ -i /tmp/source.mp4 \ -stats -c:v libx264 \ -s 1920x1080 \ -crf 22 \ -profile:v main \ -pix_fmt yuv420p \ -threads 0 \ -f mp4 -ac 2 \ -c:a aac -b:a 128k \ -strict -2 \ /tmp/output.mp4The key of this setup is the -threads 0 which tells ffmpeg that it’s an all you can eat buffet.
For test videos, HD Trailers or Sintel Trailers are great sources. I’m using a 1080p mp4 trailer for source.Helm Chart
Transcoding maps directly to the notion of Job in Kubernetes. Jobs are batch processes that can be orchestrated very easily, and configured so that Kubernetes will not restart them when the job is done. The equivalent to Deployment Replicas is Job Parallelism.
To add concurrency, I initially use this notion. It proved a bad approach, making things more complicated than necessary to analyze the output logs. So I built a chart that creates many (numbered) jobs each running a single pod, so I can easily track them and their logs.
{{- $type := .Values.type -}} {{- $parallelism := .Values.parallelism -}} {{- $cpu := .Values.resources.requests.cpu -}} {{- $memory := .Values.resources.requests.memory -}} {{- $requests := .Values.resources.requests -}} {{- $multiSrc := .Values.multiSource -}} {{- $src := .Values.defaultSource -}} {{- $burst := .Values.burst -}} --- {{- range $job, $nb := until (int .Values.parallelism) }} apiVersion: batch/v1 kind: Job metadata: name: {{ $type | lower }}-{{ $parallelism }}-{{ $cpu | lower }}-{{ $memory | lower }}-{{ $job }} spec: parallelism: 1 template: metadata: labels: role: transcoder spec: containers: - name: transcoder-{{ $job }} image: jrottenberg/ffmpeg:ubuntu args: [ "-y", "-i", "/data/{{ if $multiSrc }}source{{ add 1 (mod 23 (add 1 (mod $parallelism (add $job 1)))) }}.mp4{{ else }}{{ $src }}{{ end }}", "-stats", "-c:v", "libx264", "-s", "1920x1080", "-crf", "22", "-profile:v", "main", "-pix_fmt", "yuv420p", "-threads", "0", "-f", "mp4", "-ac", "2", "-c:a", "aac", "-b:a", "128k", "-strict", "-2", "/data/output-{{ $job }}.mp4" ] volumeMounts: - mountPath: /data name: hostpath resources: requests: {{ toYaml $requests | indent 12 }} limits: cpu: {{ if $burst }}{{ max (mul 2 (atoi $cpu)) 8 | quote }}{{ else }}{{ $cpu }}{{ end }} memory: {{ $memory }} restartPolicy: Never volumes: - name: hostpath hostPath: path: /mnt --- {{- end }}The values.yaml file that goes with this is very very simple:
# Number of // tasks parallelism: 8 # Separator name type: bm # Do we want several input files # if yes, the chart will use source${i}.mp4 with up to 24 sources multiSource: false # If not multi source, name of the default file defaultSource: sintel_trailer-1080p.mp4 # Do we want to burst. If yes, resource limit will double request. burst: false resources: requests: cpu: "4" memory: 8Gi max: cpu: "25"That’s all you need. Of course, all sources are in the repo for your usage, you don’t have to copy paste this.
Creating test files
Now we need to generate a LOT of values.yaml files to cover many use cases. The reachable values would vary depending on your context. My home cluster has 6 workers with 4 cores and 32GB RAM each, so I used
- 1, 6, 12, 18, 24, 48, 96 and 192 concurrent jobs (up to 32/worker)
- reverse that for the CPUs (from 3 to 0.1 in case of parallelism=192)
- 1 to 16GB RAM
In the cloud, I had 16 core workers with 60GB RAM, so I did the tests only on 1 to 7 CPU cores per task.
I didn’t do anything clever here, just a few bash loops to generate all my tasks. They are in the repo if needed.
Deploying Kubernetes
MAAS / AWS
The method to deploy on MAAS is the same I described in my previous blog about DIY GPU Cluster. Once you have MAAS installed and Juju configured to talk to it, you can adapt and use the bundle file in src/juju/ via:
juju deploy src/juju/k8s-maas.yamlfor AWS, use the k8s-aws.yaml bundle, which specifies c4.4xlarge as the default instances. When it’s done, download he configuration for kubectl then initialize Helm with
juju show-status kubernetes-worker-cpu --format json | \ jq --raw-output '.applications."kubernetes-worker-cpu".units | keys[]' | \ xargs -I UNIT juju ssh UNIT "sudo wget https://download.blender.org/durian/trailer/sintel_trailer-1080p.mp4 -O /mnt/sintel_trailer-1080p.mp4" done juju scp kubernetes-master/0:config ~/.kube/config helm initVariation for LXD
LXD on AWS is a bit special, because of the network. It breaks some of the primitives that are frequently used with Kubernetes such as the proxying of pods, which have to go through 2 layers of networking instead of 1. As a result,
- kubectl proxy doesn’t work ootb
- more importantly, helm doesn’t work because it consumes a proxy to the Tiller pod by default
- However, transcoding doesn’t require network access but merely a pod doing some work on the file system, so that is not a problem.
The least expensive path to resolve the issue I found is to deploy a specific node that is NOT in LXD but a “normal” VM or node. This node will be labeled as a control plane node, and we modify the deployments for tiller-deploy and kubernetes-dashboard to force them on that node. Making this node small enough will ensure no transcoding get ever scheduled on it.
I could not find a way to fully automate this, so here is a sequence of actions to run:
juju deploy src/juju/k8s-lxd-c-.yamlThis deploys the whole thing and you need to wait until it’s done for the next step. Closely monitor juju status until you see that the deployment is OK, but flannel doesn’t start (this is expected, no worries).
Then adjust the LXD profile for each LXD node must to allow nested containers. In a near future (roadmapped for 2.3), Juju will gain the ability to declare the profiles it wants to use for LXD hosts. But for now, we need to build that manually:
NB_CORES_PER_LXD=4 #This is the same number used above to deploy for MACHINE in 1 2 do ./src/bin/setup-worker.sh ${MACHINE} ${NB_CORES_PER_LXD} doneIf you’re watching juju status you will see that flannel suddenly starts working. All good! Now download he configuration for kubectl then initialize Helm with
juju scp kubernetes-master/0:config ~/.kube/config helm initWe need to identify the Worker that is not a LXD container, then label it as our control plane node:
kubectl label $(kubectl get nodes -o name | grep -v lxd) controlPlane=true kubectl label $(kubectl get nodes -o name | grep lxd) computePlane=trueNow this is where it become manual we need to edit successively rc/monitoring-influxdb-grafana-v4, deploy/heapster-v1.2.0.1, deploy/tiller-deploy and deploy/kubernetes-dashboard, to add
nodeSelector: controlPlane: “true”in the definition of the manifest. Use
kubectl edit -n kube-system rc/monitoring-influxdb-grafana-v4After that, the cluster is ready to run!
Running transcoding jobs
Starting jobs
We have a lot of tests to run, and we do not want to spend too long managing them, so we build a simple automation around them
cd src TYPE=aws CPU_LIST="1 2 3" MEM_LIST="1 2 3" PARA_LIST="1 4 8 12 24 48" for cpu in ${CPU_LIST}; do for memory in ${CPU_LIST}; do for para in ${PARA_LIST}; do [ -f values/values-${para}-${TYPE}-${cpu}-${memory}.yaml ] && \ { helm install transcoder --values values/values-${para}-${TYPE}-${cpu}-${memory}.yaml sleep 60 while [ "$(kubectl get pods -l role=transcoder | wc -l)" -ne "0" ]; do sleep 15 done } done done doneThis will run the tests about as fast as possible. Adjust the variables to fit your local environment
First approach to Scheduling
Without any tuning or configuration, Kubernetes makes a decent job of spreading the load over the hosts. Essentially, all jobs being equal, it spreads them like a round robin on all nodes. Below is what we observe for a concurrency of 12.
NAME READY STATUS RESTARTS AGE IP NODE bm-12–1–2gi-0–9j3sh 1/1 Running 0 9m 10.1.70.162 node06 bm-12–1–2gi-1–39fh4 1/1 Running 0 9m 10.1.65.210 node07 bm-12–1–2gi-11–261f0 1/1 Running 0 9m 10.1.22.165 node01 bm-12–1–2gi-2–1gb08 1/1 Running 0 9m 10.1.40.159 node05 bm-12–1–2gi-3-ltjx6 1/1 Running 0 9m 10.1.101.147 node04 bm-12–1–2gi-5–6xcp3 1/1 Running 0 9m 10.1.22.164 node01 bm-12–1–2gi-6–3sm8f 1/1 Running 0 9m 10.1.65.211 node07 bm-12–1–2gi-7–4mpxl 1/1 Running 0 9m 10.1.40.158 node05 bm-12–1–2gi-8–29mgd 1/1 Running 0 9m 10.1.101.146 node04 bm-12–1–2gi-9-mwzhq 1/1 Running 0 9m 10.1.70.163 node06The same spread is realized also for larger concurrencies, and at 192, we observe 32 jobs per host in every case. Some screenshots of kubeUI and Grafana of my tests
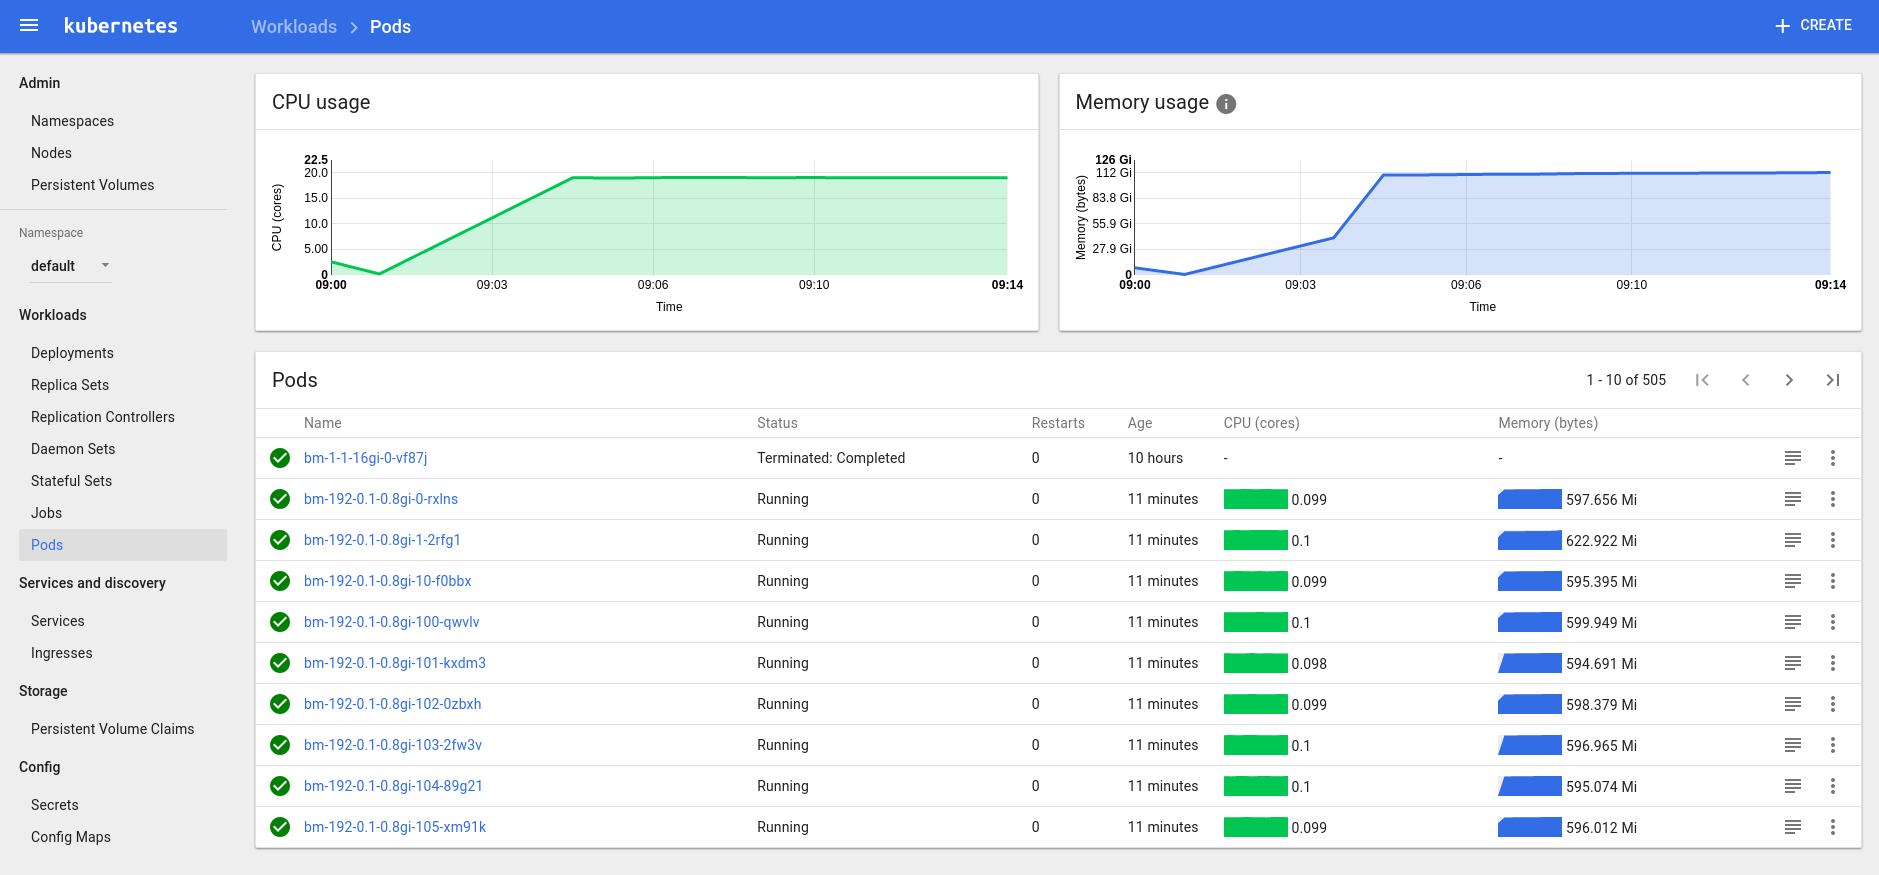
KubeUI showing 192 concurrent pods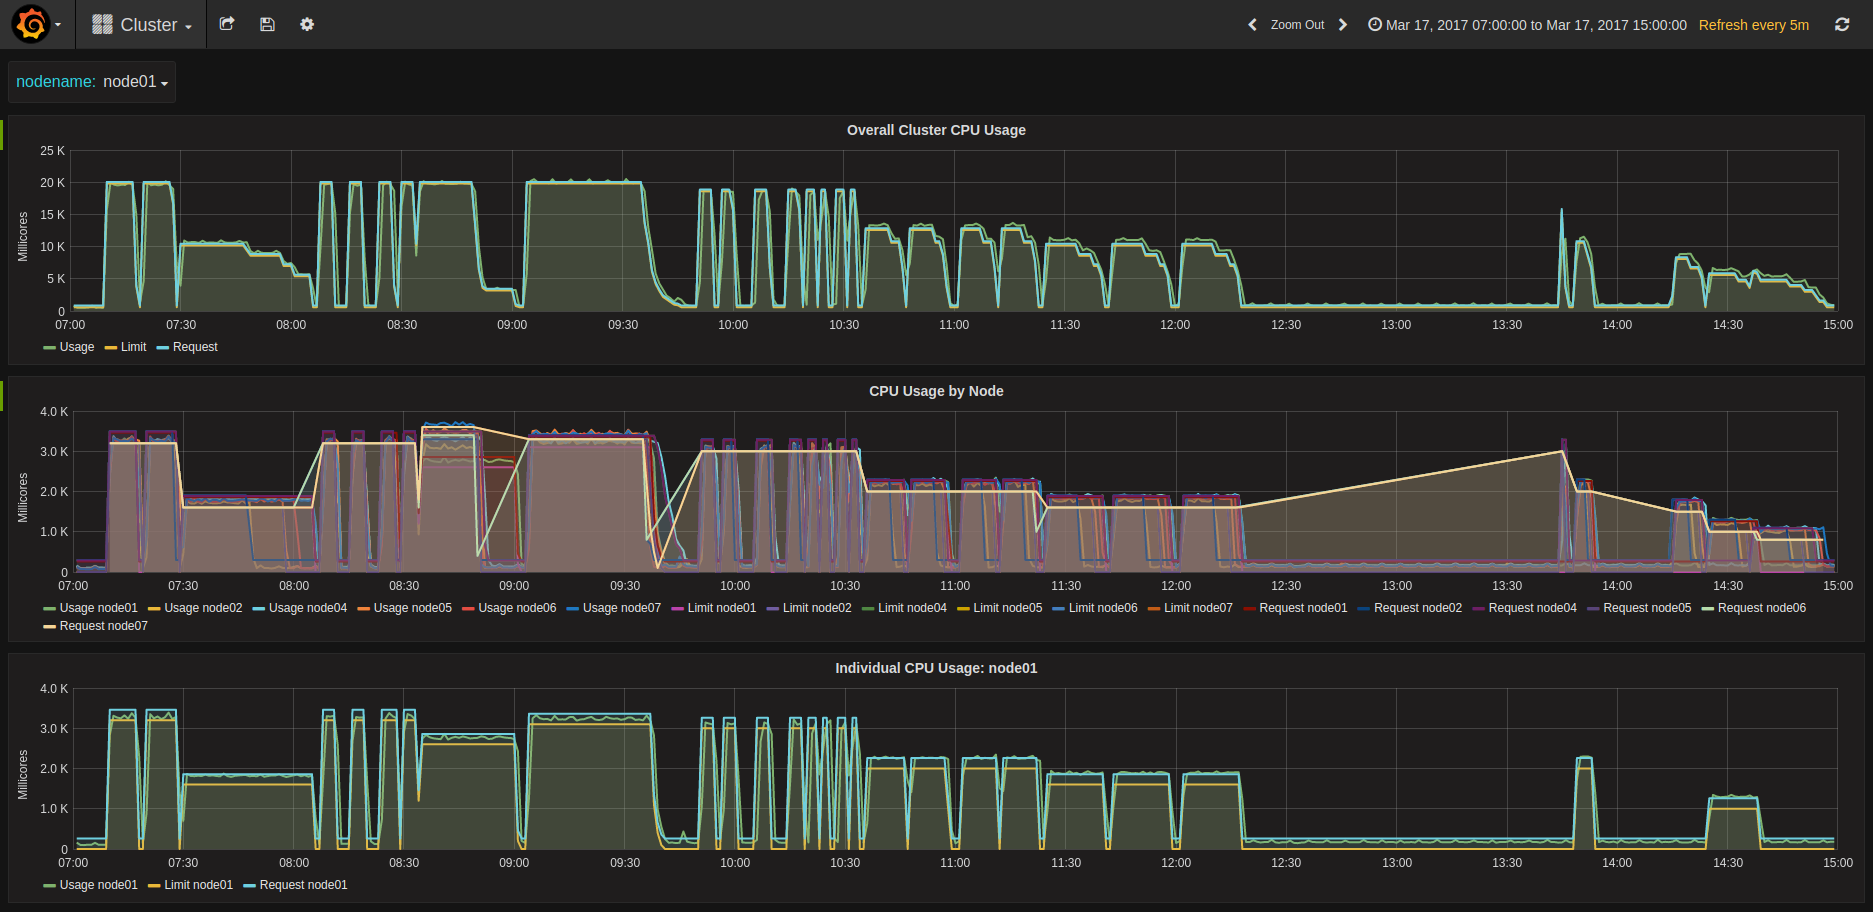
Compute Cycles at different concurrencies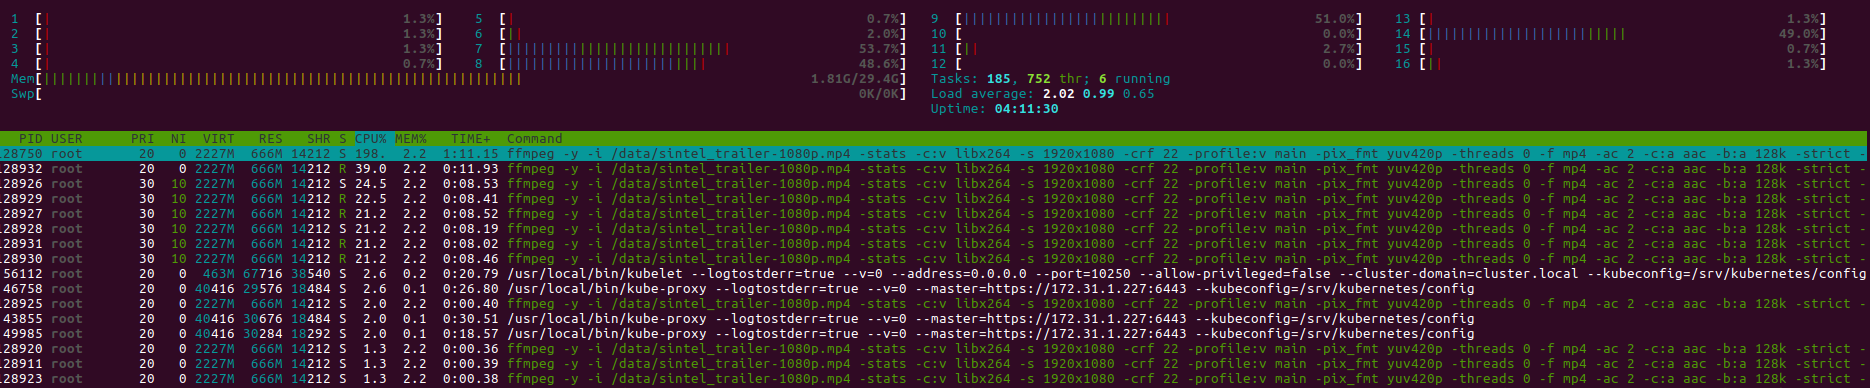
LXD pining Kubernetes Workers to CPUs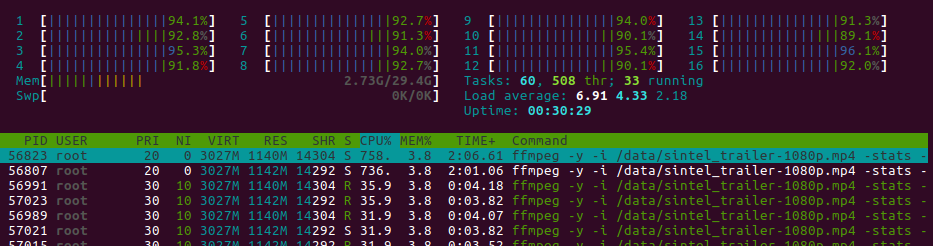
Aoutch! About 100% on the whole machineCollecting and aggregating results
Raw Logs
This is where it becomes a bit tricky. We could use an ELK stack and extract the logs there, but I couldn’t find a way to make it really easy to measure our KPIs.
Looking at what Docker does in terms of logging, you need to go on each machine and look into /var/lib/docker/containers//-json.log
Here we can see that each job generates exactly 82 lines of log, but only some of them are interesting:-
First line: gives us the start time of the log
{“log”:”ffmpeg version 3.1.2 Copyright © 2000–2016 the FFmpeg developers\n”,”stream”:”stderr”,”time”:”2017–03–17T10:24:35.927368842Z”}
-
line 13: name of the source
{“log”:”Input #0, mov,mp4,m4a,3gp,3g2,mj2, from ‘/data/sintel_trailer-1080p.mp4’:\n”,”stream”:”stderr”,”time”:”2017–03–17T10:24:35.932373152Z”}
-
last line: end of transcoding timestamp
{“log”:”[aac @ 0x3a99c60] Qavg: 658.896\n”,”stream”:”stderr”,”time”:”2017–03–17T10:39:13.956095233Z”}
For advanced performance geeks, line 64 also gives us the transcode speed per frame, which can help profile the complexity of the video. For now, we don’t really need that.
Mapping to jobs
The raw log is only a Docker uuid, and does not help use very much to understand to what job it relates. Kubernetes gracefully creates links in /var/log/containers/ mapping the pod names to the docker uuid:
bm-1–0.8–1gi-0-t8fs5_default_transcoder-0-a39fb10555134677defc6898addefe3e4b6b720e432b7d4de24ff8d1089aac3a.log So here is what we do:-
Collect the list of logs on each host:
for i in $(seq 0 1 ${MAX_NODE_ID}); do [ -d stats/node0${i} ] || mkdir -p node0${i} juju ssh kubernetes-worker-cpu/${i} "ls /var/log/containers | grep -v POD | grep -v 'kube-system'" > stats/node0${i}/links.txt juju ssh kubernetes-worker-cpu/${i} "sudo tar cfz logs.tgz /var/lib/docker/containers" juju scp kubernetes-worker-cpu/${i}:logs.tgz stats/node0${i}/ cd node0${i}/ tar xfz logs.tgz --strip-components=5 -C ./ rm -rf config.v2.json host* resolv.conf* logs.tgz var shm cd .. done
2. Extract import log lines (adapt per environment for nb of nodes…)
ENVIRONMENT=lxd MAX_NODE_ID=1 echo "Host,Type,Concurrency,CPU,Memory,JobID,PodID,JobPodID,DockerID,TimeIn,TimeOut,Source" | tee ../db-${ENVIRONMENT}.csv for node in $(seq 0 1 ${MAX_NODE_ID}); do cd node0${node} while read line; do echo "processing ${line}" NODE="node0${node}" CSV_LINE="$(echo ${line} | head -c-5 | tr '-' ',')" # node it's -c-6 for logs from bare metal or aws, -c-5 for lxd UUID="$(echo ${CSV_LINE} | cut -f8 -d',')" JSON="$(sed -ne '1p' -ne '13p' -ne '82p' ${UUID}-json.log)" TIME_IN="$(echo $JSON | jq --raw-output '.time' | head -n1 | xargs -I {} date --date='{}' +%s)" TIME_OUT="$(echo $JSON | jq --raw-output '.time' | tail -n1 | xargs -I {} date --date='{}' +%s)" SOURCE=$(echo $JSON | grep from | cut -f2 -d"'") echo "${NODE},${CSV_LINE},${TIME_IN},${TIME_OUT},${SOURCE}" | tee -a ../../db-${ENVIRONMENT}.csv done < links.txt cd .. doneOnce we have all the results, we load to Google Spreadsheet and look into the results…
Results Analysis
Impact of Memory
Once the allocation is above what is necessary for ffmpeg to transcode a video, memory is a non-impacting variable at the first approximation. However, at the second level we can see a slight increase in performance in the range of 0.5 to 1% between 1 and 4GB allocated.
Nevertheless, this factor was not taken into account.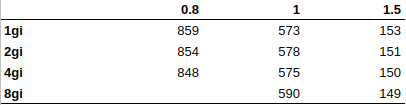
RAM does not impact performance (or only marginally)Impact of CPU allocation & Pinning
Regardless of the deployment method (AWS or Bare Metal), there is a change in behavior when allocating less or more than 1 CPU “equivalent”.
Being below or above the line
Running CPU allocation under 1 gives the best consistency across the board. The graph shows that the variations are contained, and what we see is an average variation of less than 4% in performance.
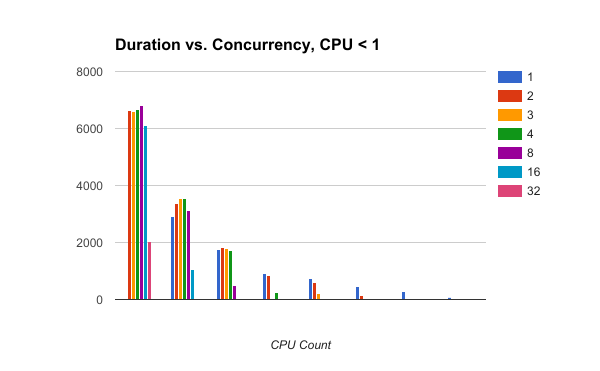
Low CPU per pod gives low influence of concurrencyRunning jobs with CPU request Interestingly, the heatmap shows that the worse performance is reached when ( Concurrency * CPU Counts ) ~ 1. I don’t know how to explain that behavior. Ideas?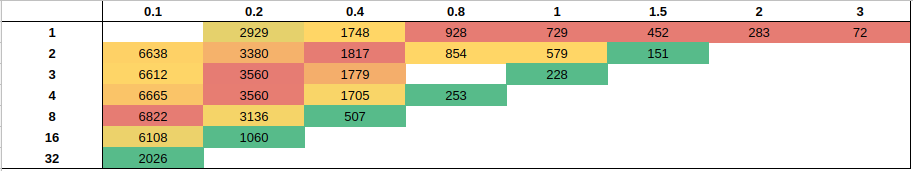
If total CPU is about 1 the performance is the worse.Being above the line
As soon as you allocate more than a CPU, concurrency directly impacts performance. Regardless of the allocation, there is an impact, with concurrency 3.5 leading to about 10 to 15% penalty. Using more workers with less cores will increase the impact, up to 40~50% at high concurrency
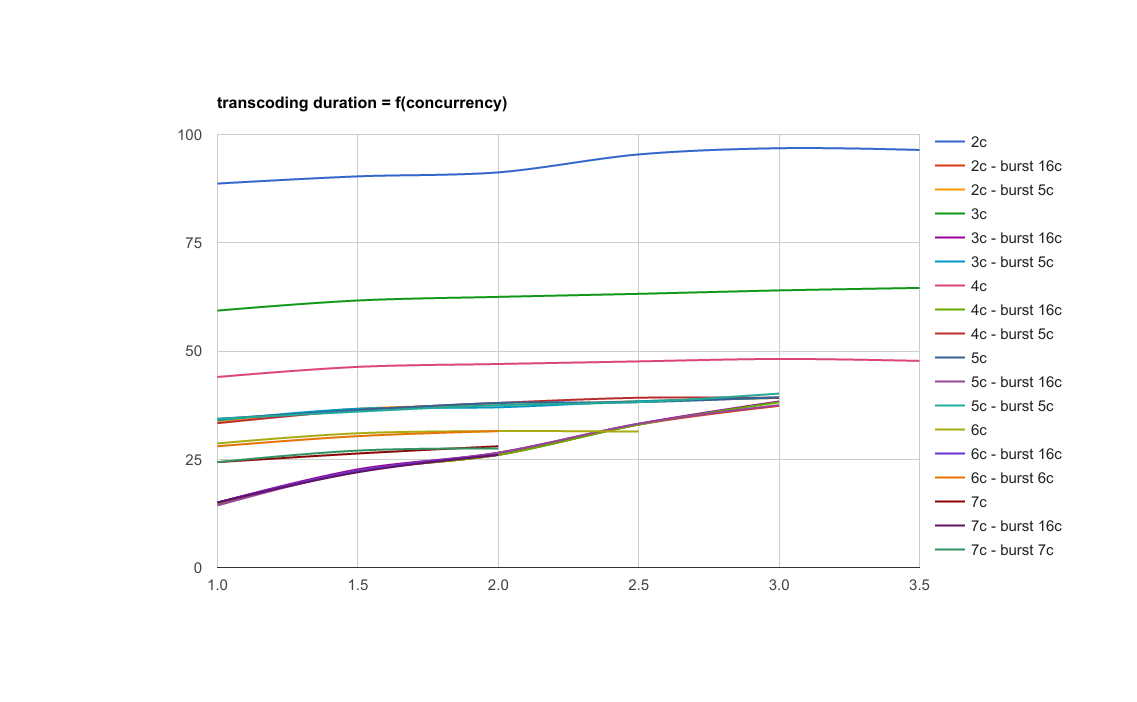
As the graphs show, not all concurrencies are made equal. The below graphs show duration function of concurrency for various setups.
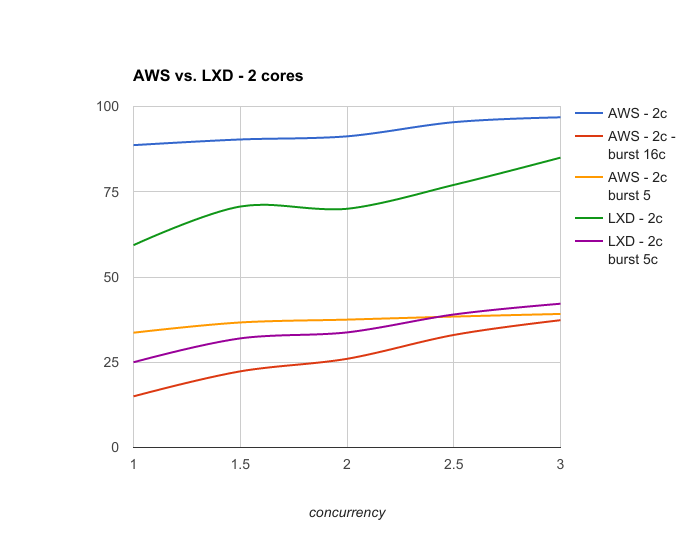
AWS with or without LXD, 2 cores / job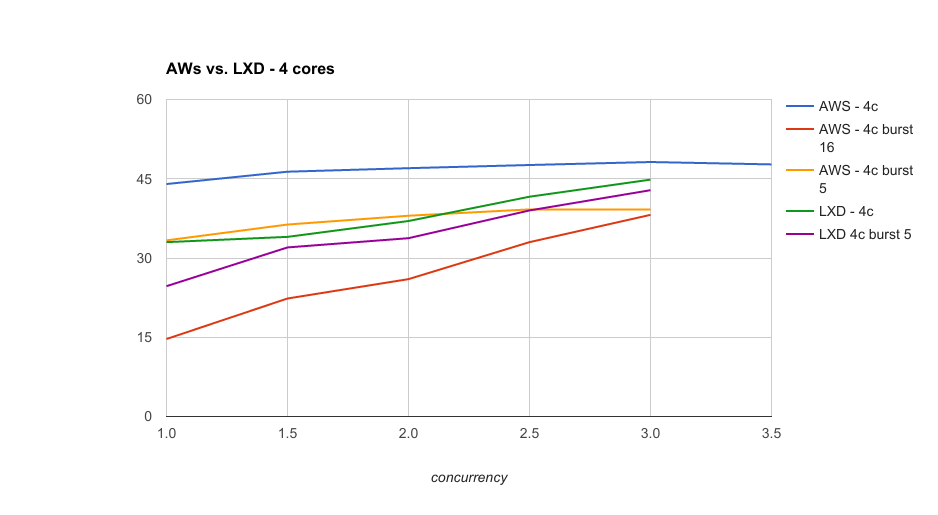
With 4 Cores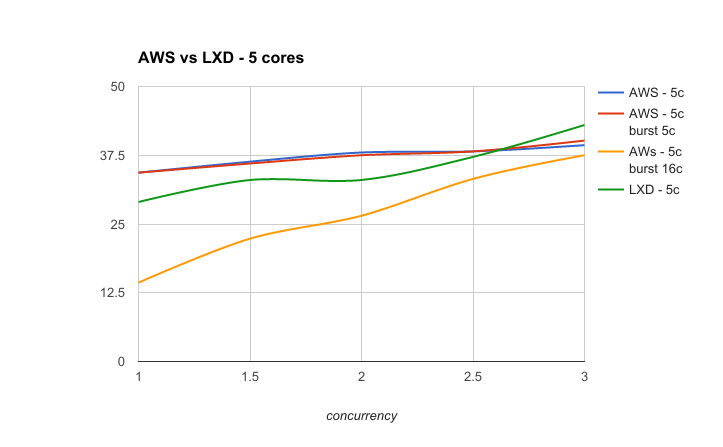
and 5 cores / jobWhen concurrency is low and the performance is well profiled, then slicing hosts thanks to LXD CPU pinning is always a valid strategy.By default, LXD CPU-pinning in this context will systematically outperform the native scheduling of Docker and Kubernetes. It seems a concurrency of 2.5 per host is the point where Kubernetes allocation becomes more efficient than forcing the spread via LXD.
However, unbounding CPU limits for the jobs will let Kubernetes use everything it can at any point in time, and result in an overall better performance.
When using this last strategy, the performance is the same regardless of the number of cores requested for the jobs. The below graph summarizes all results:
All results: unbounding CPU cores homogenizes performanceImpact of concurrency on individual performance
Concurrency impacts performance. The below table shows the % of performance lost because of concurrency, for various setups.
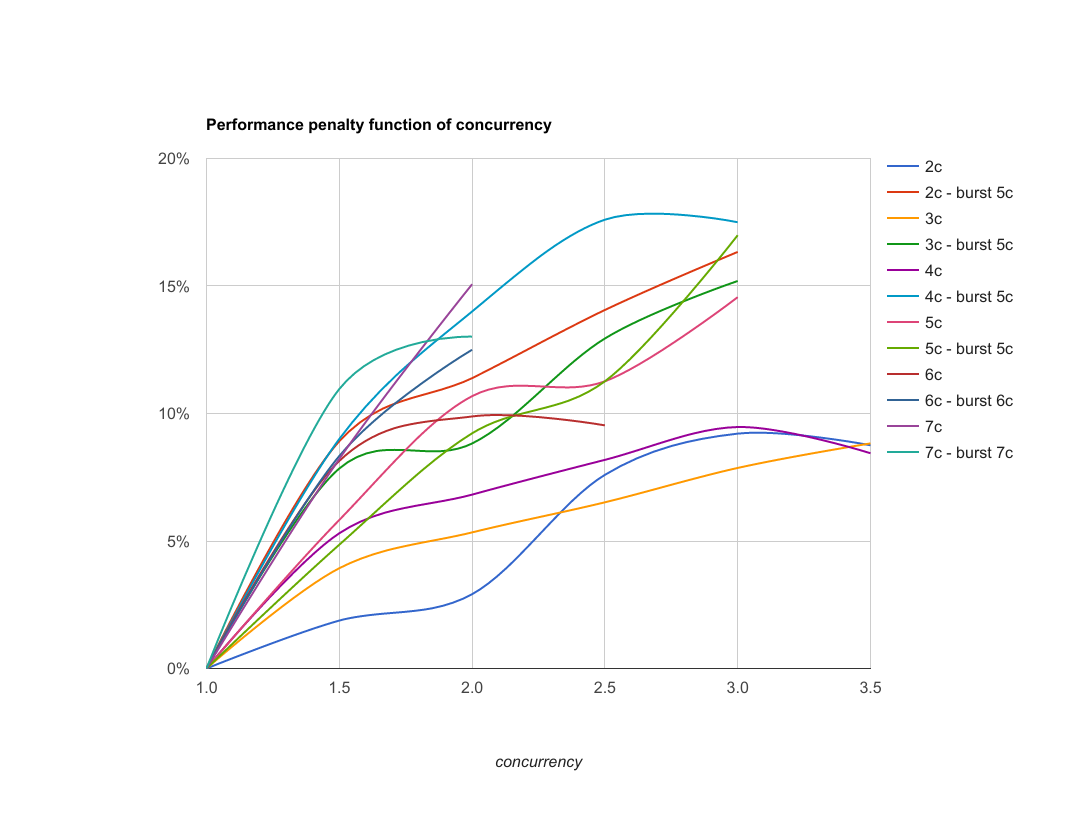
Performance is impacted from 10 to 20% when concurrency is 3 or moreConclusion
In the context of transcoding or another CPU intensive task,
- If you always allocate less than 1 CPU to your pods, concurrency doesn’t impact CPU-bound performance; Still, be careful about the other aspects. Our use case doesn’t depend on memory or disk IO, yours could.
- If you know in advance your max concurrency and it is not too high, then adding more workers with LXD and CPU pinning them always gets you better performance than native scheduling via Docker. This has other interesting properties, such as dynamic resizing of workers with no downtime, and very fast provisioning of new workers. Essentially, you get a highly elastic cluster for the same number of physical nodes. Pretty awesome.
- The winning strategy is always to super provision CPU limits to the max so that every bit of performance is allocated instantly to your pods. Of course, this cannot work in every environment, so be careful when using this, and test if it fits with your use case before applying in production.
These results are in AWS, where there is a hypervisor between the metal and the units. I am waiting for hardware with enough cores to complete the task. If you have hardware you’d like to throw at this, be my guest and I’ll help you run the tests.
Finally and to open up a discussion, a next step could also be to use GPUs to perform this same task. The limitation will be the number of GPUs available in the cluster. I’m waiting for some new nVidia GPUs and Dell hardware, hopefully I’ll be able to put this to the test.
There are some unknowns that I wasn’t able to sort out. I made the result dataset of ~3000 jobs open here, so you can run your own analysis! Let me know if you find anything interesting!
https://insights.ubuntu.com/2017/03/27/job-concurrency-in-kubernetes-lxd-cpu-pinning-to-the-rescue/
© Lightnetics 2024