Blog: Monitoring Kubernetes Workloads: The Sidecar Pattern
-
Kubernetes has entirely changed the way we build infrastructure, speeding up deployments and letting us replicate and scale microservice architectures. That speed comes with a new set of challenges around how we maintain visibility and monitor infrastructure.
In this post, I’ll recap the webinar Sensu CEO Caleb Hailey did with the CNCF, where he discussed some of the existing and popular patterns for monitoring Kubernetes (like Prometheus) and why traditional methods fall short in a cloud-native world. I’ll also go over current best practices for monitoring workloads on Kubernetes, including the sidecar pattern for monitoring.
Containers: the new reality
We’ve long been relying on microservices to ship software faster and more reliably in the cloud. Containerization was the natural next step in that evolution and — in conjunction with Kubernetes for container orchestration — has enabled us (and forced us, really) to rethink how we deploy and monitor applications.
Cloud computing is here to stay, and while Kubernetes is a powerful platform for deploying applications no matter where they run, that kind of power introduces a lot more complexity.
Monitoring Kubernetes: the challenges and data sources
Adopting Kubernetes means contending with an enormous variety of data sources. These data sources are all abstractions, so to gain visibility into the health and performance of the system, you need access to monitoring data down the stack.
Sensu CTO Sean Porter outlines the data sources in detail in this post. In short, you need to be able to collect data from four primary sources:
- The Kubernetes hosts running the Kubelet. The most common way to get data out of these hosts is to use the Prometheus node exporter, which scrapes data from the Kubernetes host and exposes system resource telemetry data on an HTTP endpoint.
- The Kubernetes process, AKA Kubelet metrics. These provide details on Kubernetes nodes and the jobs they run.
- The Kubelet’s built-in cAdvisor, which helps keep track of resource usage for running containers.
- Kube-state-metrics for a big picture view at the Kubernetes cluster level.
The dynamic nature of Kubernetes requires a dynamic approach to monitoring that can contend with high volumes of distributed applications and ephemeral infrastructure.
Kubernetes monitoring strategies
Broadly speaking, here are the monitoring strategies as I see them:
- Remote polling - The traditional service check approach that polls devices and reports on their health.
- Node-based (agent per host) - A monitoring agent lives on the Kubernetes host or is operated as a DaemonSet inside the Kubernetes cluster with the appropriate configuration to gain access to info about system resources.
- Sidecars (agent per pod) - The approach we’ll discuss below that monitors the Kubernetes system as well as the workloads it’s running.
- Logs & APMs - Management of both log data and application performance, which is out of scope for today’s discussion.
With these observability approaches in mind, let’s take a closer look at one of the more traditional ways for monitoring Kubernetes: using Prometheus.
Prometheus + Kubernetes
Sean writes about the ways that Prometheus can be a great telemetry-based monitoring companion to Kubernetes. In particular, if you don’t want your developers to have to think about modifying their deployment YAML, Prometheus is great for that. You can instrument your apps and expose telemetry-focused metrics. Developers can reference a ConfigMap to make use of a sidecar pattern, (more details on that below).
However, if you need the additional functional service health checking, you can’t really map “Is this thing healthy or not?” to a 1 and a 0 with Prometheus. To check functional service health, you need to look elsewhere.
A more comprehensive approach: the sidecar pattern
The sidecar pattern of monitoring Kubernetes is a more dynamic approach, and the early days of its adoption have been fun to follow. In fact, sidecars as a pattern aren’t a formal convention of Kubernetes, but they’ve picked up speed as the Kubernetes community experiments and figure out what works.
Examples of Kubernetes sidecars include:
- Service mesh
- Logging platforms with agents that run as sidecars
- Monitoring solutions like Sensu with an agent that runs as a sidecar, giving you a 1:1 pairing of a monitoring agent per collection of services.
When you use the sidecar pattern, your Kubernetes pod holds the container that runs your app alongside the container that runs the Sensu agent. These containers share the same network space so your applications can talk to Sensu as if they were running in the same container or host.
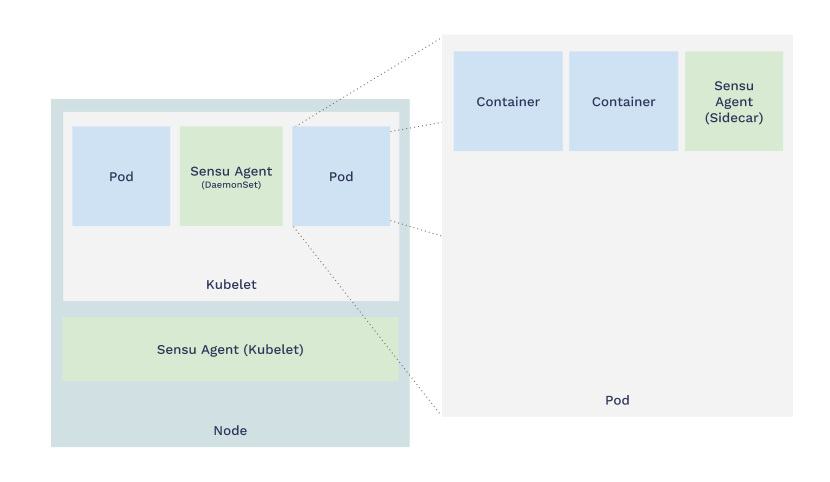
The benefits of sidecars align with the very same values that give microservices an advantage in a cloud-native context. Sidecars are:
- Modular
- Composable
- Reusable
For more info on what makes the sidecar pattern the most flexible way to monitor Kubernetes, check out this blog post.
Demos: Getting started with sidecars
In this tutorial, we’ll deploy an example application (a default NGINX website) in Kubernetes using Kubectl to manage the deployment. In the second part of the demo, we’ll look at how to monitor the application we’ve deployed.
If you want to follow along at home, you’ll need to install Kubernetes (or set up the Minikube tool to run Kubernetes locally) and deploy Sensu into Kubernetes. As a companion to Sensu, I also have InfluxDB as my time-series database and Grafana for building custom visualization dashboards.
First, deploy your NGINX deployment using
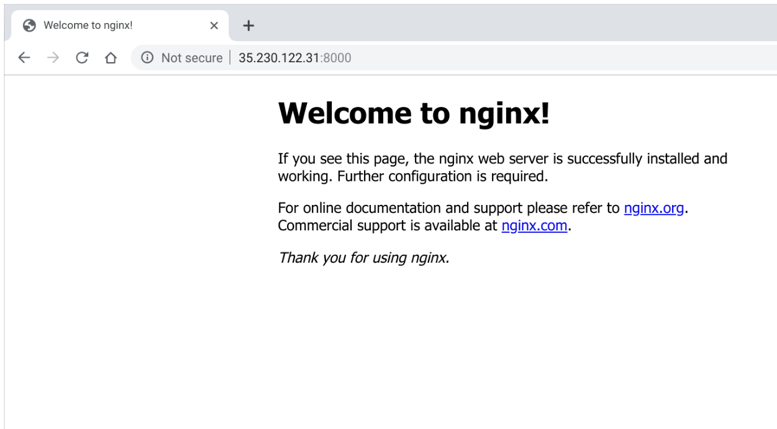
kubectl apply:$ kubectl create namespace webinar $ kubectl --namespace webinar apply -f kubernetes/nginx-deployment.yaml $ kubectl --namespace webinar get services NAME TYPE CLUSTER-IP EXTERNAL-IP PORT(S) AGE nginx LoadBalancer 10.27.251.183 35.230.122.31 8000:30161/TCP 33dThe NGINX container by default runs on port 80. I expose that outside of the Kubernetes cluster at port 8000.
Now, visit your example application in your browser, accessible at http://35.230.122.31:8000 And, voilà! We’ve launched a new service, all powered by Kubernetes.
This is the stage that a lot of you may have reached: You’ve deployed an app or service in Kubernetes, but want to figure out the best way to monitor it.
Let’s look at how to add the Sensu Go agent as a sidecar to your application. (This works with all Kubernetes controllers: deployments, Statefulsets, DaemonSets, and so on.)
Update your deployment using
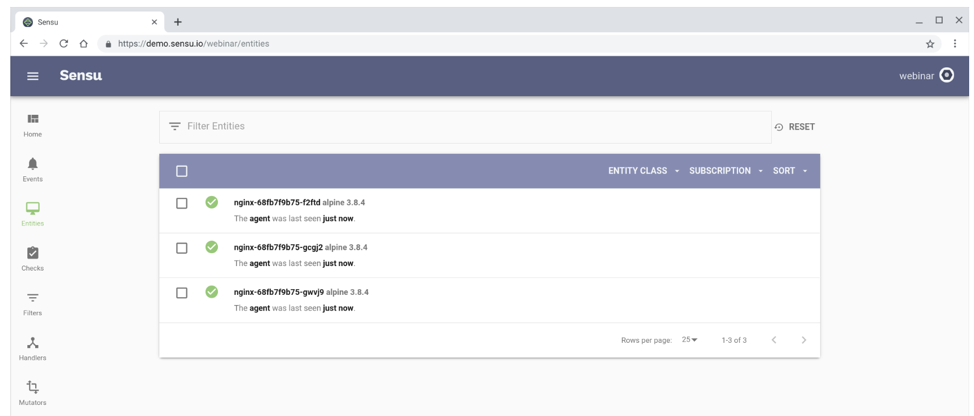
kubectl apply:$ kubectl --namespace webinar apply -f kubernetes/nginx-deployment-with-sensu-sidecar.yamlVisit the Sensu dashboard, and you’ll see Sensu auto-register the sidecars. (Sensu also automatically de-registers nodes, so you can tell the difference between a node that’s down versus one that’s been de-provisioned.)
Here’s the excerpt from the
.spec.template.spec.containersscope in the Kubernetes deployment that makes this possible:- name: sensu-agent image: sensu/sensu:5.11.1 command: ["/opt/sensu/bin/sensu-agent", "start", "--log-level=debug", "--insecure-skip-tls-verify", "--keepalive-interval=5", "--keepalive-timeout=10"] env: - name: SENSU_BACKEND_URL value: wss://sensu-backend-0.sensu.sensu-system.svc.cluster.local:8081 wss://sensu-backend-1.sensu.sensu-system.svc.cluster.local:8081 wss://sensu-backend-2.sensu.sensu-system.svc.cluster.local:8081 - name: SENSU_NAMESPACE value: webinar - name: SENSU_SUBSCRIPTIONS value: linux kubernetes nginx - name: SENSU_DEREGISTER value: "true" - name: SENSU_STATSD_EVENT_HANDLERS value: statsdNow that you have this configuration in place, you can scale resources easily.
$ kubectl --namespace webinar scale deployment nginx --replicas 10Before we configure the monitoring check, I’ll provide some background on Sensu’s architecture and how the services communicate. The Sensu agent communicates with the Sensu backend in a pub-sub model, and the agent only requires outbound network access so we don’t have to open ports in the agent or on the pod to get access to them. Agents have TLS-encrypted web sockets in Sensu Go, and they maintain this connection with the Sensu backend, with built-in support for high availability.
When the agent connects, it self-describes its role. In the case of a sidecar, it says, “I’m on Kubernetes, I’m a Docker container, and my role is an nginx service.” The agents subscribe to topics, called subscriptions, on the backend in order to gather data. Sensu supports a wide variety of plugins, from Nagios plugins to your localhost StatsD socket to Prometheus endpoints and more.
In this tutorial, we’ll configure a simple check with the Nagios
check_httpplugin.First, you need to provide the Sensu configuration, which includes four main attributes: resource type, API version, metadata, and spec. These get registered in the control plane and associate with the monitoring check configuration.
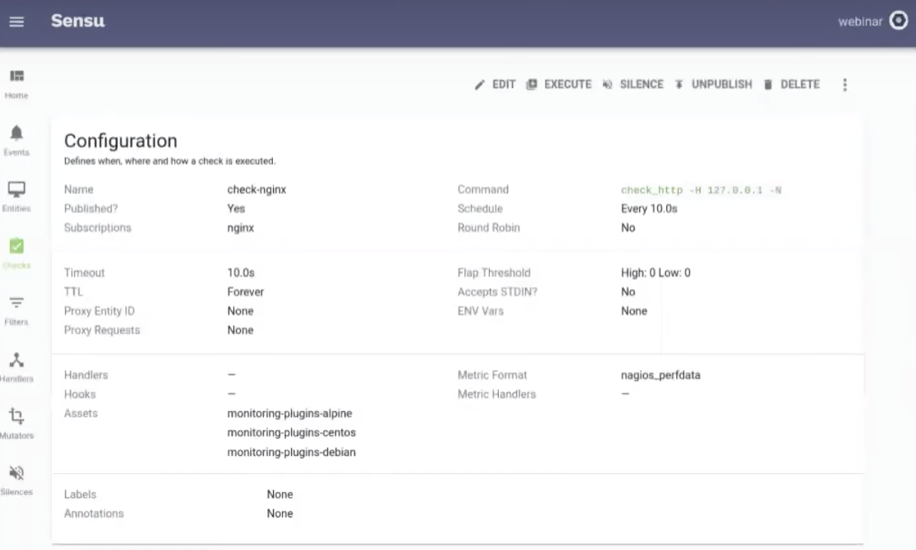
For example, here’s a monitoring check in Sensu with the plugins needed to register that check:
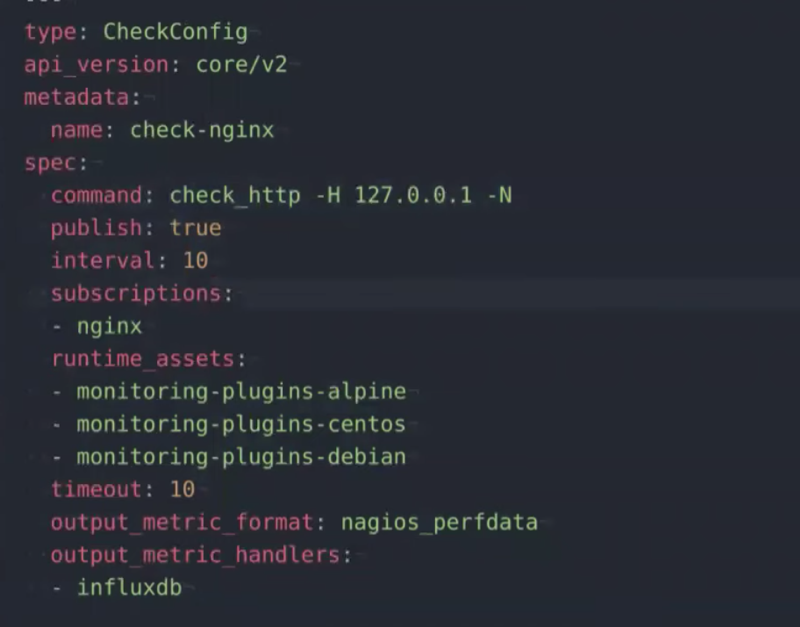
The output is in the format of
nagios_perfdata, and I want it to write to InfluxDB.Let’s configure the monitoring check:
$ sensuctl --namespace webinar create -f sensu/checks/check-nginx.yamlYou’ll see the configuration appear in your Sensu dashboard, where it can be edited if needed, and it’ll automatically execute on all three of your Kubernetes pods.
Here’s your service check result:

Eventually, we want a dashboard of this data, and that’s why Sensu’s monitoring event pipeline makes a big impact. You can configure an InfluxDB handler in Sensu that converts the data from its Nagios format to InfluxDB format, so it can be written into InfluxDB and you can start seeing the metrics on your Granfana dashboard.
Here’s how to configure the telemetry pipeline (InfluxDB handler):
$ sensuctl --namespace webinar create -f sensu/handlers/influxdb.yamlYou can revisit these configurations in GitHub, and I’d love to hear your feedback on this tutorial.
Over to you
There you have it! Now you’ve got a simple pipeline set up that collects metrics from Kubernetes via a sidecar pattern and is able to send the data to Grafana for visualization.
If you’d like to learn more about the InfluxDB handler (or any of the other handlers that you can use with Sensu Go, including handlers for PagerDuty, ElasticSearch, Splunk, etc.), visit Bonsai, the Sensu community’s directory of open source assets.
https://kubernetes.io/blog/2020/04/16/monitoring-kubernetes-sidecar-pattern/
© Lightnetics 2024