Balance your spend across YouTube and TV with Reach Planner
-
YouTube is focused on helping brands reach their audiences and drive business impact. That’s why we launched Reach Planner in April 2018 to give advertisers a better way to plan their YouTube and video media. To help make it even easier for users to for users to discover the optimal mix of TV and YouTube to maximize the reach of a video based media plan, today we’re launching Nielsen TV Data in Reach Planner. Now you can see how different distributions of spend on TV and YouTube can affect your reach.
Using this together with Nielsen Total Ad Ratings (TAR), you can compare YouTube and TV reach from the planning stages through to post campaign reporting.
With audiences shifting to digital, it’s important to plan TV and digital together
With audiences shifting to digital, it’s important to plan across channels. According to Nielsen, there are thirty one percent fewer available weekly 18-49 GRPs across broadcast and cable television compared to just five years ago. TV’s decline in reach to 18-49 year olds now requires a forty six percent increase in frequency for marketers to achieve the same GRP levels.1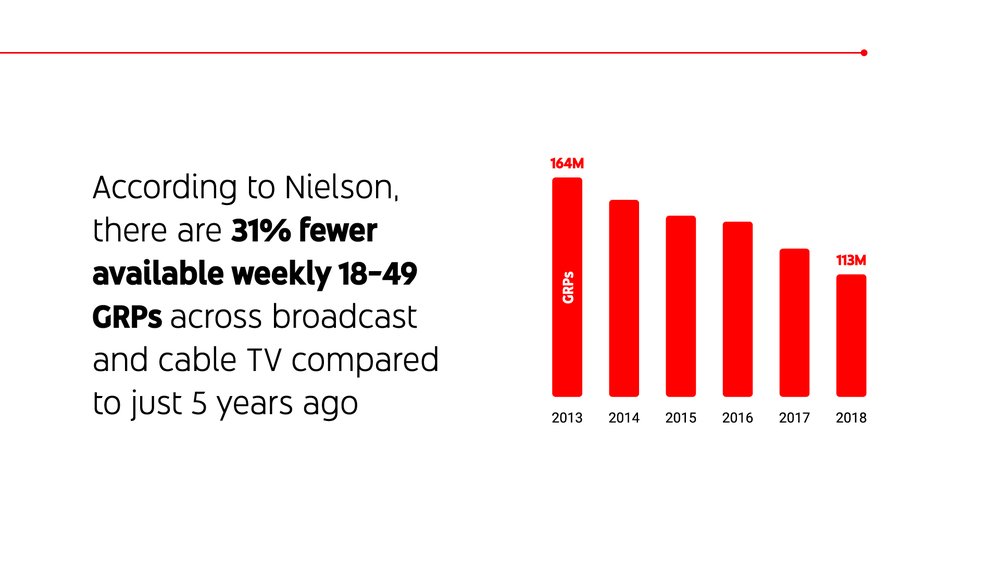
Advertisers can offset this decline and grow their business by adding YouTube to their overall video plan. Across the 20 Total Ad Ratings (TAR) studies we’ve commissioned with Nielsen, YouTube has consistently driven incremental reach at a more balanced frequency compared to TV.2
Get started in Reach Planner
By adding Nielsen TV data to Reach Planner, advertisers can optimize their mix of TV and online video to maximize reach, balance frequency, and reduce waste. Advertisers can also change the mix of YouTube formats to see the effect on the overall campaign.
TV Data in Reach Planner is available to all users of Reach Planner in the US. This feature will be available in more countries in 2020.
To get started, reach out to your Google team to get TV Data in Reach Planner enabled for your planning team.
1. Nielsen, NTI, U.S., Npower Reach & Frequency Report, Sept. 30, 2013–Oct. 27, 2013 vs. Oct. 1, 2018–Oct. 28, 2018.2. "Nielsen Total Ad Ratings (TAR) Meta Analysis, including all 20 TAR US studies inclusive of YouTube in-app traffic commissioned by Google running from January 2018 to March 2019 across desktop, mobile and TV. Incremental Reach Value calculated as YouTube’s on-target incremental reach / YouTube’s Total on-target Reach. Standard Deviation 22%. On Target Frequency calculated as On Target Impressions / On Target Reach. Standard Deviation 6.5
https://www.blog.google/products/ads/balance-your-spend-across-youtube-and-tv-reach-planner/
© Lightnetics 2024